24 miles of 115 kV, re-rated from LiDAR to load limit
A public utility district needed updated ratings for about 24 miles of 115 kV transmission across six line segments. With line modeling led by our transmission partner, Anders Dahl, PE of Grasher Consulting, our team carried the analysis from LiDAR survey data to delivered ratings, with every limit traceable to the spans that control it.
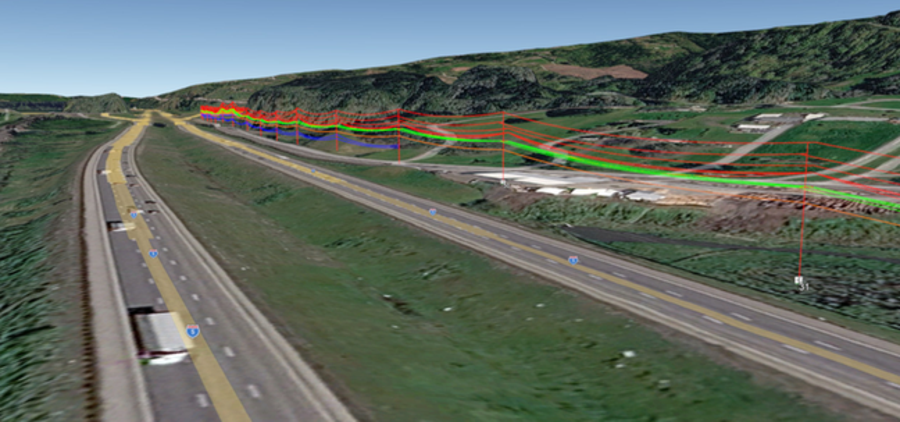
LINE MODELING
Each segment was modeled in PLS-CADD from LiDAR and field records: conductor types, attachment heights, and the underbuilt distribution that complicates every real corridor.
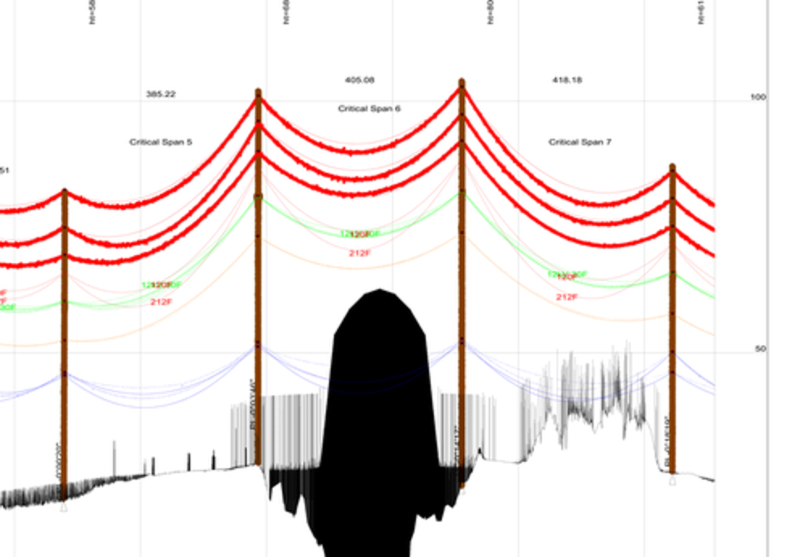
CLEARANCE ANALYSIS
Segments were checked against NESC clearances with the district’s adopted buffers, and a maximum safe operating temperature was established for each.
A line rating you cannot trace to a controlling span is a guess with a stamp on it. Every one of ours traces.
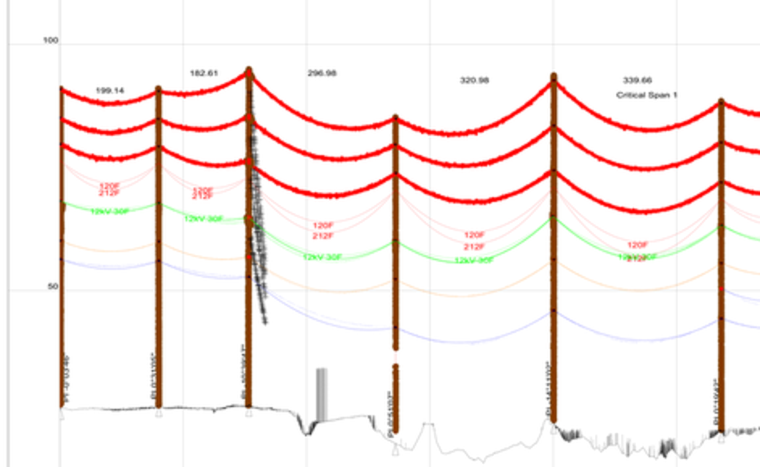
BOTTOM LINE
- A client needed to know what their transmission could really carry.
- Our team measured it, modeled it, and put the controlling spans on paper.